Temperature-anomalies
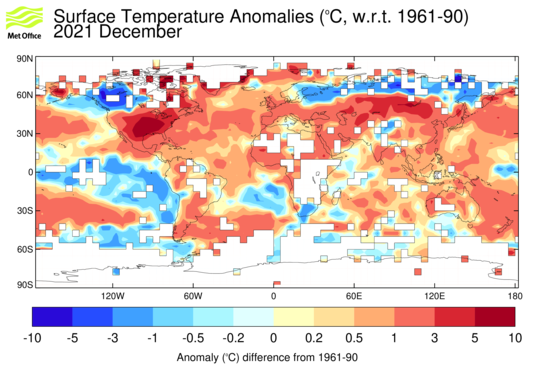
Mean: 1961-1990.
Data courtnesy of HadCrut4 | UK MetOffice/Hadley Centre .

Log Files
Like many other Web sites, this site makes use of log files. The information inside the log files includes internet protocol ( IP ) addresses, type of browser, Internet Service Provider ( ISP ), date/time stamp, referring/exit pages, and number of clicks to analyze trends, administer the site, track user?s movement around the site, and gather demographic information. IP addresses, and other such information are not linked to any information that is personally identifiable.
Cookies and Web Beacons
this site does use cookies to store information about visitors preferences, record user-specific information on which pages the user access or visit, customize Web page content based on visitors browser type or other information that the visitor sends via their browser.
IP addresses and other information are not linked to personally identifiable information.
DoubleClick DART Cookie
.:: Google, as a third party vendor, uses cookies to serve ads on this site.
.:: Google's use of the DART cookie enables it to serve ads to your users based on their visit to this site and other sites on the Internet.
.:: Users may opt out of the use of the DART cookie by visiting the Google ad and content network privacy policy at the following URL - http://www.google.com/privacy_ads.html
Some of our advertising partners may use cookies and web beacons on our site. Our advertising partners include Google Adsense.
These third-party ad servers or ad networks use technology to the advertisements and links that appear on this site send directly to your browsers. They automatically receive your IP address when this occurs. Other technologies ( such as cookies, JavaScript, or Web Beacons ) may also be used by the third-party ad networks to measure the effectiveness of their advertisements and / or to personalize the advertising content that you see.
This site has no access to or control over these cookies that are used by third-party advertisers.
You should consult the respective privacy policies of these third-party ad servers for more detailed information on their practices as well as for instructions about how to opt-out of certain practices. This site's privacy policy does not apply to, and we cannot control the activities of, such other advertisers or web sites.
If you wish to disable cookies, you may do so through your individual browser options. More detailed information about cookie management with specific web browsers can be found at the browsers' respective websites.